Khadoor Sahib Lok Sabha constituency is one of the 13 Lok Sabha constituencies in the Indian state of Punjab. It comprises 9 assembly constituencies and 4 districts.
Category
Designated as a General Constituency.
Voter Turnout
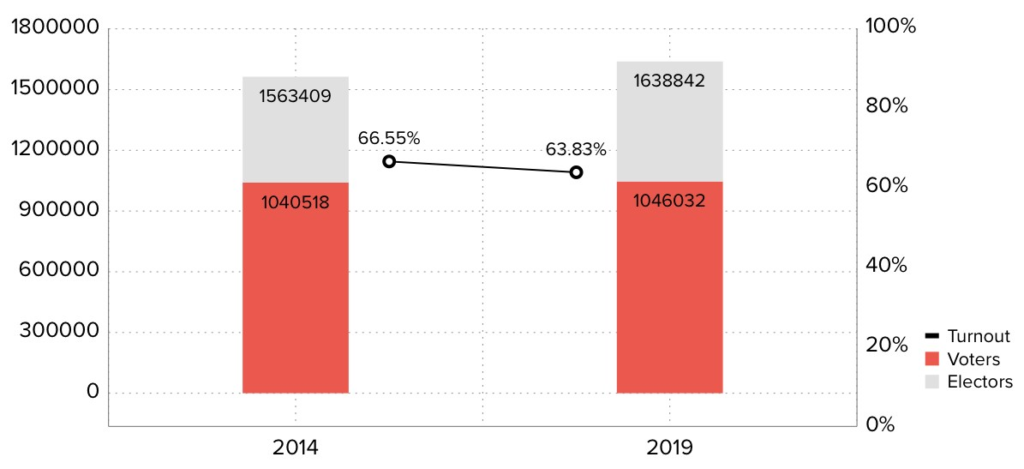
Khadoor Sahib Electoral Turnout Rates
During the 2014 elections, the total number of electors was 15,63,409 and the turnout stood at 66.55%, in real numbers- 10,40,518 voters. 2019 witnessed a turnout decrease; out of the 16,38,842 electors, 63.83% of voters exercised their constitutional rights. In real numbers- 10,46,032 voters.
Representation and Results
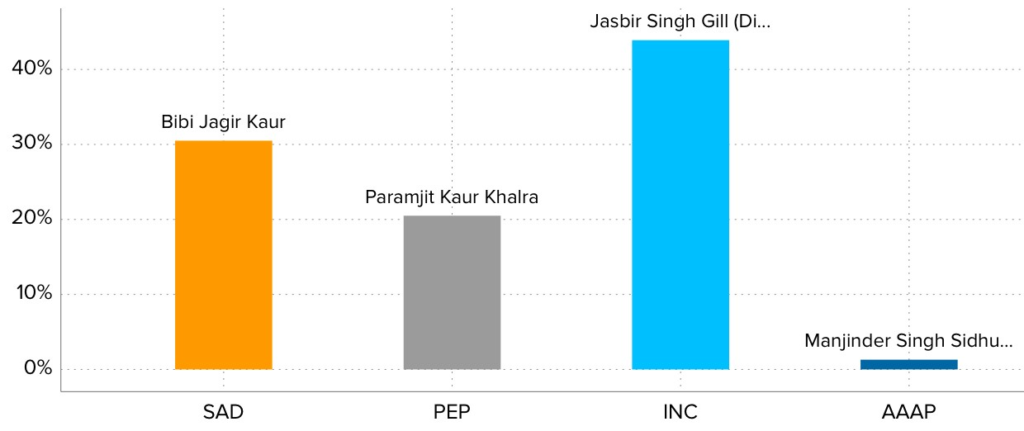
Party Wise Vote Share
2019’s parliamentary election winner, INC’s Jasbir Singh Gill gained a vote share of 43.90% and defeated BJP’s Bibi Jagir Kaur whose vote share stood at 30.50%. The other prominent candidates in the fray were PEP’s Paramjit Kaur Khalra with 20.50% of vote share and AAAP’s Manjinder Singh Sidhu with 1.30%.
Voting History –2014 & 2019
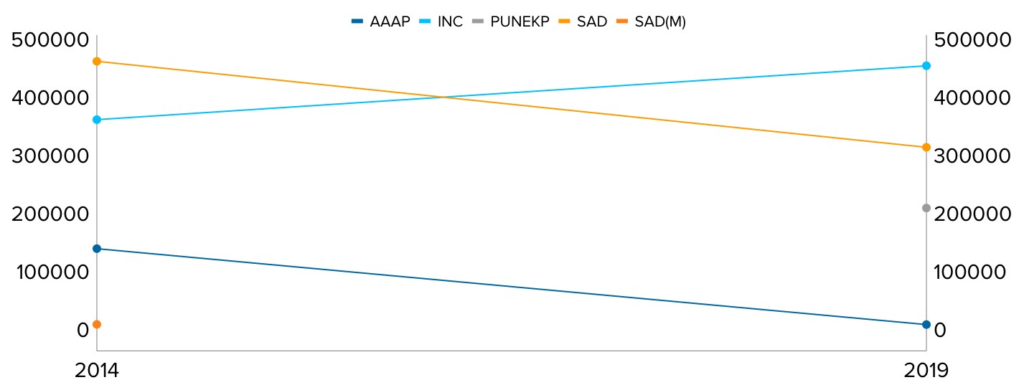
Party Wise Shift in Votes
In 2014, BJP won the constituency and earned 4,67,332 votes followed by 3.19.137 votes in the 2019 election victory. On the other hand, INC garnered 3,66,763 votes in 2014 and 4,59,710 votes in the 2019 elections. AAAP received 1,44,521 votes in 2014 which substantially decreased to 13,656 votes in the 2019 elections.
Parties at helm through the years
This constituency came into existence as a part of the implementation of the delimitation of parliamentary and assembly constituencies in 2008. It has been represented by different parties over the years.

Timeline of Winning Parties
In 2009, the SAD party emerged victorious, securing power and followed it with another win in the 2014 elections. In 2019, the INC managed to wrest away the power from SAD and assumed power in the constituency.
Party-wise success rate
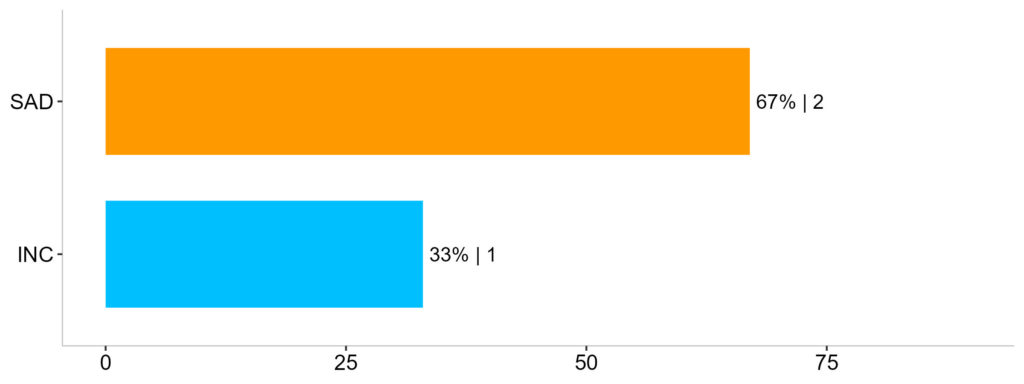
Success Rate
In terms of the success rate in securing the Khadoor Sahib Lok Sabha seat, SAD had exhibited the highest rate of success in the elections held since 2009, standing at 67% followed by INC at 33%.
Gender Wise Distribution of Contestants
During the 2009 elections, there were 15 contestants with 14 being males and 1 being female, in percentage- 93% and 7% respectively. The next elections in 2014 saw an increase in contestant participation to 17 but it was limited to males only.
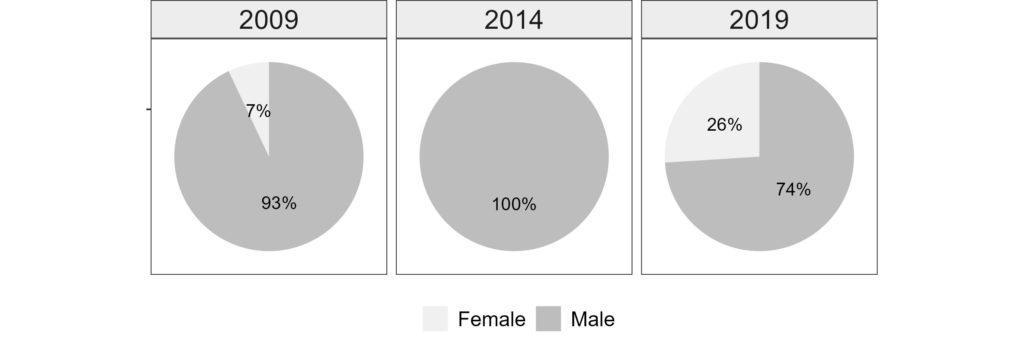
Gender Wise Distribution of Candidates
In 2019, the total number of contestants further increased to 19 whereby 15 were males and 4 females, in percentage that is 74% and 26% respectively.
Gender wise voter turnout
In 2009, out of a total of 13,31,992 electors, 9,46,560 voters cast their ballots. Of the 6,84,014 male electors, 4,84,603 participated in the election, constituting a turnout rate of 71%. There were 6,47,978 female electors and of that, 4,61,957 chose to vote with a turnout rate of 71%.
In 2014, there are 15,63,256 people who are eligible to vote and 10,40,518 of them chose to exercise their right to vote. Out of these, 8,17,062 were male electors and 7,46,194 were female electors. 66% of male electors (5,36,595) and 68% of female electors (5,03,923) cast their ballots.
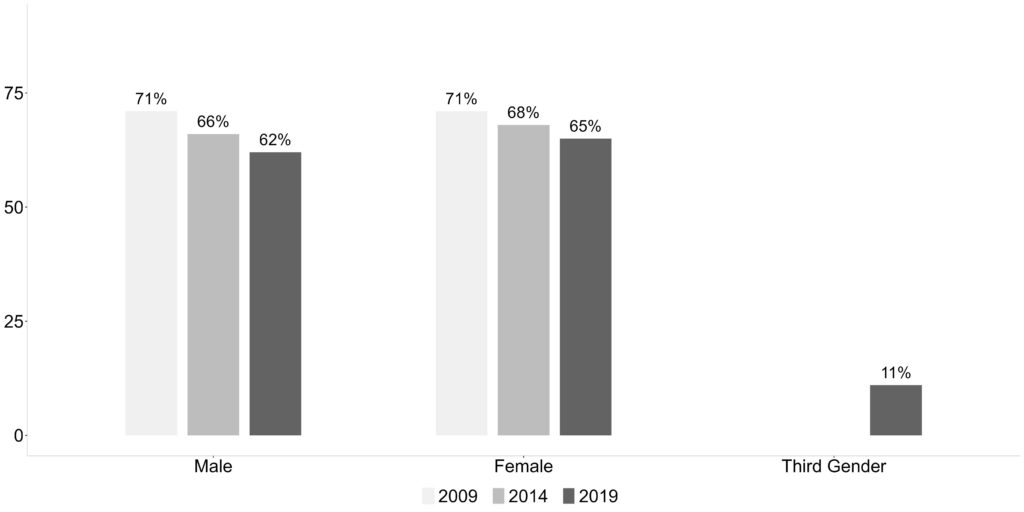
Gender Wise Voter Turnout
The total count of electors in 2019 was 16,38,842 out of which 10,40,636 chose to cast their ballot in the parliamentary elections. Out of 8,67,894 male electors, only 62% voted which is 5,42,159 male voters in real numbers. On the other hand, the voter turnout for females stood at 65% which translates to 4,98,469 voters out of a total of 7,70,875 female electors in real number.
In 2017, transgender people were included as a separate category of the third gender in electoral rolls. There were 73 electors belonging to the third gender category in the parliamentary constituency during the 2019 elections. And 8 of them exercised their newly granted constitutional right to vote and thus their turnout stood at 11%.
Gender-Wise Literacy Rate
We are taking a peek at the gender-wise literacy rate of the Kapurthala, Amritsar, Tarn Taran and Firozpur districts which are part of the Khadoor Sahib parliamentary constituency as literacy is considered an essential indicator of the socioeconomic development of the region.
Kapurthala District
The 2011 census of India has pegged the overall literacy rate of the district at 71%. Gender-wise, the male literacy rate in the district is 74% whereas, for females, the literacy rate stands at 64%.
Amritsar District
The overall literacy rate of the district is 68%. However, when it comes to gender, the literacy rate for males in the district stands at 71% while the female literacy rate is 64%.
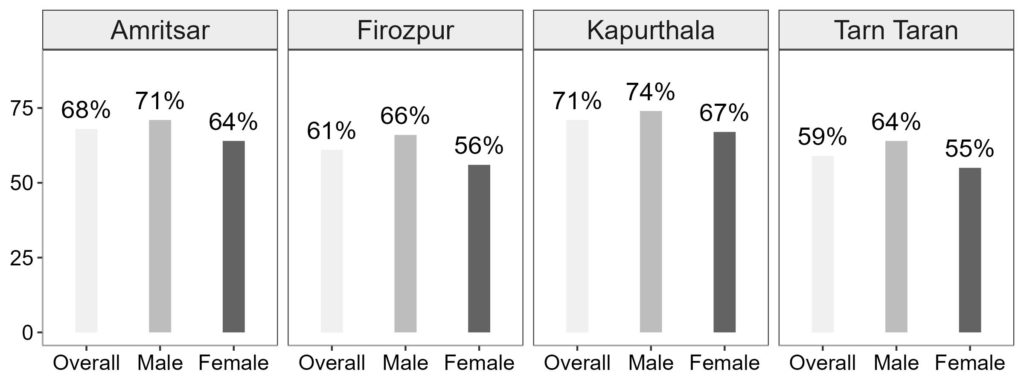
Gender Wise Literacy Rate
Tarn Taran District
The district boasts an overall literacy rate of 59% with healthy representation by both males and females at 65% and 55% respectively.
Firozpur District
The district boasts an overall literacy rate of 61% with healthy representation by both males and females at 66% and 56% respectively.
Stay updated on the electoral statistics for parliamentary constituencies and the changing dynamics on Meradesh App. Available on Appstore and Play Store.
Reach your constituents, gain insights into their motivations, and build campaigns based on data-driven strategies with the Meradesh Platform.
Data Source – Meradesh.org