Location
Etawah Lok Sabha constituency is one of the 80 Lok Sabha constituencies in the Indian state of Uttar Pradesh. It comprises 5 assembly constituencies and 3 districts.
Category
Designated as a Scheduled Caste Constituency.
Voter Turnout
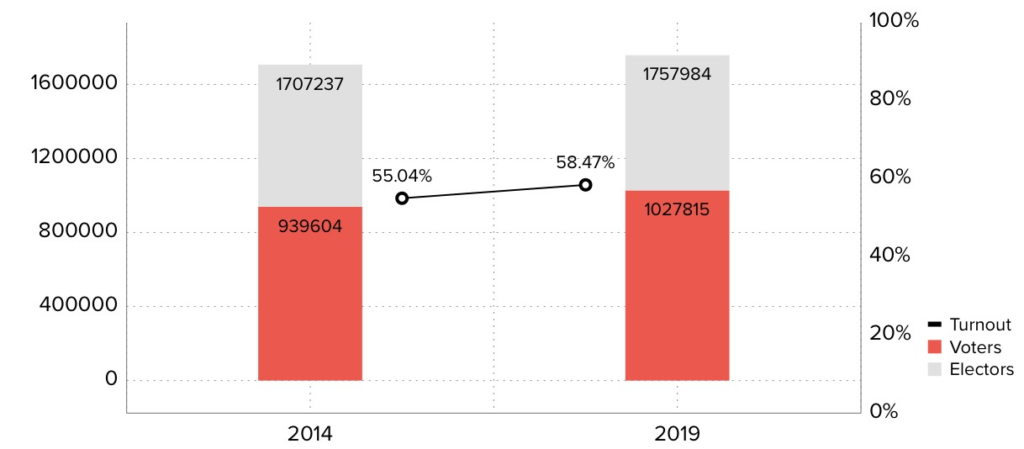
Etawah Electoral Turnout Rates
During the 2014 elections, the total number of electors was 17,07,237 and the turnout stood at 55.04%, in real numbers- 9,39,604 voters. 2019 witnessed a turnout increase; out of the 17,57,984 electors, 58.47% of voters exercised their constitutional rights. In real numbers- 10,27,815 voters.
Representation and Results
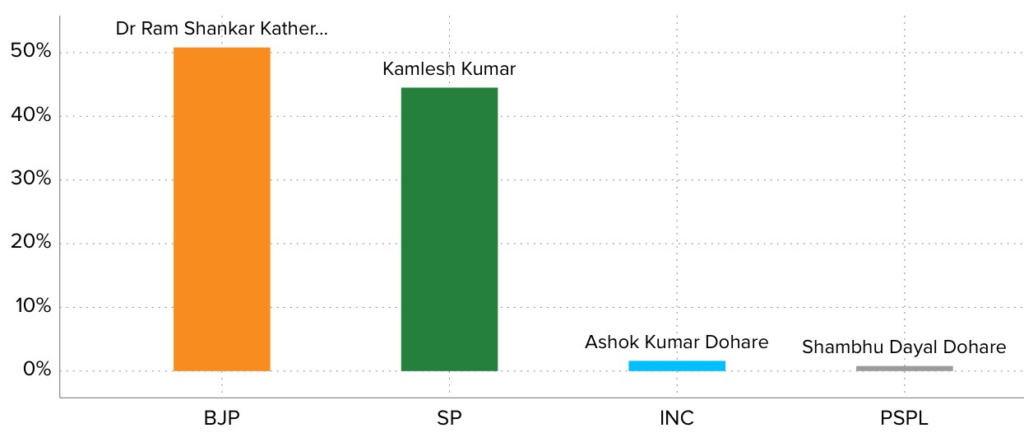
Party Wise Vote Share
2019’s parliamentary election winner, BJP’s Dr. Ram Shankar Kather gained a vote share of 50.80% and defeated SP’s Kamlesh Kumar whose vote share stood at 44.50%. The other prominent candidates in the fray were INC’s Ashok Kumar Dohare with 1.60% of vote share and PSPL’s Shambhu Dayal Dohare with 0.80% of vote share.
Voting History –2014 & 2019
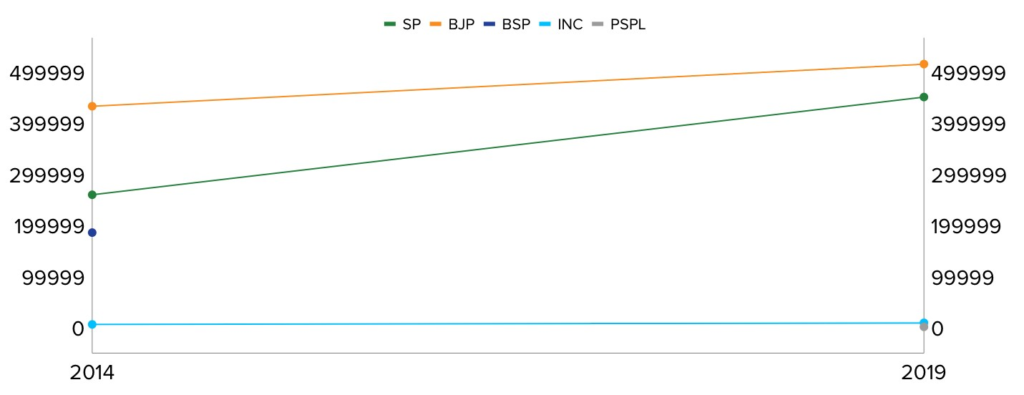
Party Wise Shift in Votes
In 2014, BJP won the constituency and earned 4,39,646 votes followed by 5,22,119 votes in the 2019 election victory. On the other hand, SP garnered 2,66,700 votes in 2014 and 4,57,682 votes in the 2019 elections.
Parties at helm through the years
The Etawah constituency has been represented by a number of different parties over the years.
In 1962 with the Indian National Congress (INC) taking the reins of the government. In 1967, the Socialist Party (SSP) briefly took charge, but the INC regained control in 1971. The political landscape witnessed a shift in 1977 when the Janata Party (JP) rose to power, which was succeeded by another JP victory in 1980. However, the INC regained dominance in 1984, leading the country until 1989 when the Janata Dal (JD) assumed office.
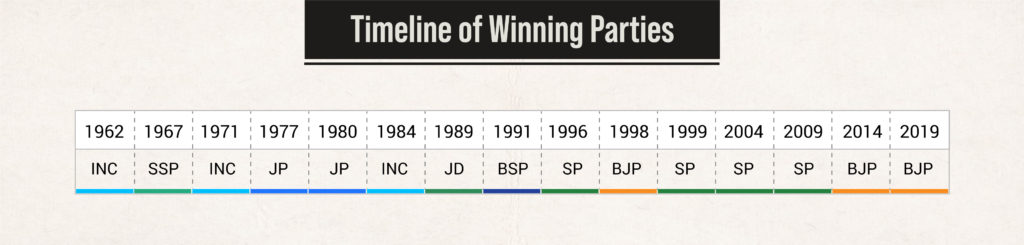
Timeline of Winning Parties
*We have excluded the 1957 elections from the table as the constituency had two seats at that time.
In 1991, the Bahujan Samaj Party (BSP) claimed power, followed by the Samajwadi Party (SP) in 1996. The Bharatiya Janata Party (BJP) came to power in 1998 before losing to the SP in 1999 after a brief tenure. SP regained rein in 2004 and continued it to the following election in 2009. The BJP emerged victorious in the 2014 elections and further consolidated its hold by winning in 2019 as well.
Party-wise success rate
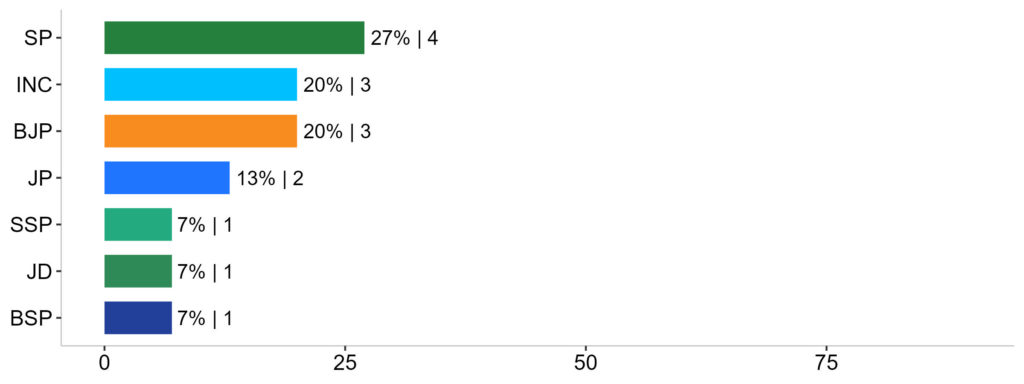
Success Rate
*We have excluded the 1957 elections from the table as the constituency had two seats at that time.
In terms of the success rate in securing the Etawah Lok Sabha seat, SP had exhibited the highest rate of success over the years, standing at 27%. Among other prominent parties, both INC and BJP enjoyed a success rate of 20% each.
Gender Wise Distribution of Contestants
During the 2009 elections, there were 13 contestants and 11 of them were male and 2 females, in percentage- 85% and & 15%. In 2014, the total number of contestants decreased to 10, out of which 9 were male and 1 was female, in percentage- 90% and 10%.
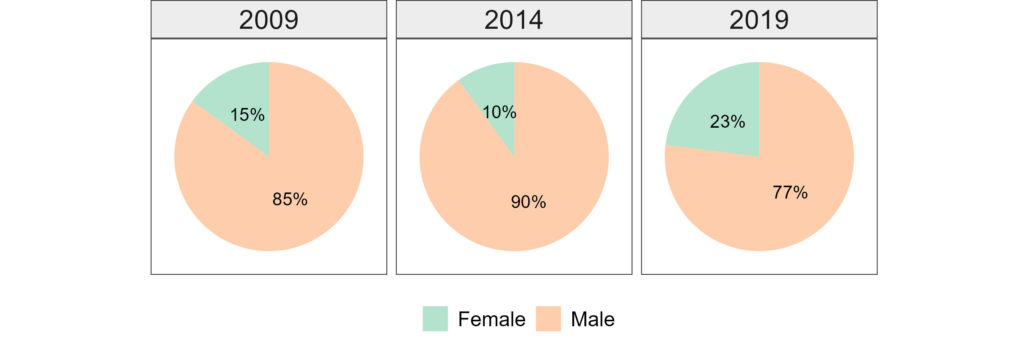
Gender Wise Distribution of Candidates
In 2019, on the other hand, the total number of contestants were increased to 13 whereby 10 were males and 3 females, in percentage that is 77% and 23% respectively.
Gender wise voter turnout
In 2009, out of a total of 14,14,801 electors, 6,37,849 voters cast their ballots. Of the 7,86,288 male electors, 3,86,777 participated in the election, constituting a turnout rate of 49%. There were 6,28,513 female electors and of that, 2,51,072 chose to vote with a turnout rate of 40%.
In 2014, there are 17,07,237 people who are eligible to vote and 9,39,604 of them chose to exercise their right to vote. Out of these, 9,38,271 were male electors and 7,68,966 were female electors. 57% of male electors (5,30,688) and 53% of female electors (4,08,916) cast their ballots.
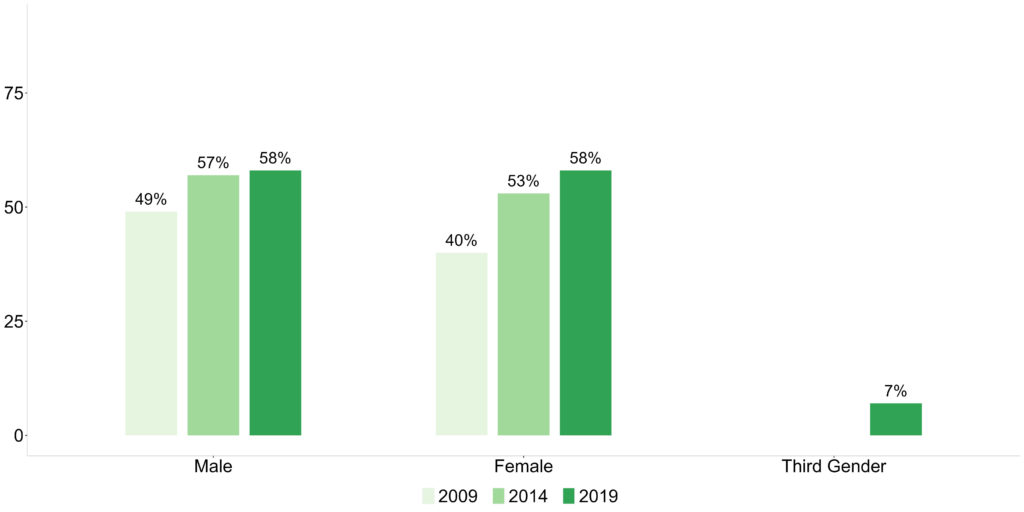
Gender Wise Voter Turnout
The total count of electors in 2019 was 17,57,984 out of which 10.23,450 chose to cast their ballot in the parliamentary elections. Out of 9,56,876 male electors, only 58% voted which is 5,58,646 male voters in real numbers. On the other hand, the voter turnout for females stood at 58% which translates to 4,64,983 voters out of a total of 8,01,062 female electors in real number.
In 2017, transgender people were included as a separate category of the third gender in electoral rolls. There were 46 electors belonging to the third gender category in the parliamentary constituency during the 2019 elections. And 3 of them exercised their newly granted constitutional right to vote and thus their turnout stood at 7%.
Gender-Wise Literacy Rate
We are taking a peek at the gender-wise literacy rate of the Etawah, Kanpur Dehat and Auraiya districts which are part of the Etawah parliamentary constituency as literacy is considered an essential indicator of the socioeconomic development of the region.
Etawah District
The 2011 census of India has pegged the overall literacy rate of the Etawah district at 67%. Gender-wise, the male literacy rate in the district is 74% whereas, for females, the literacy rate stands at 60%.
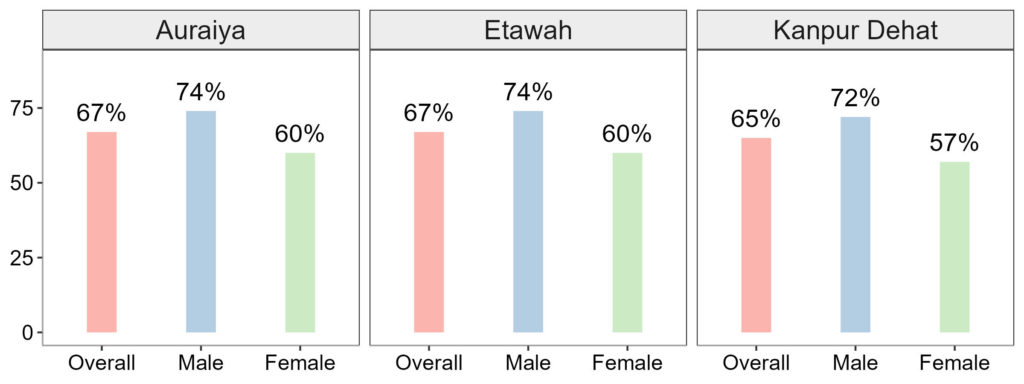
Gender Wise Literacy Rate
Kanpur Dehat District
The overall literacy rate of the district is 65%. However, when it comes to gender, the literacy rate for males in the district stands at 72% while the female literacy rate is 57%.
Auraiya District
The overall literacy rate of the district is 67% whereas gender-wise it is 74% for males and 60% for females.
Stay updated on the electoral statistics for parliamentary constituencies and the changing dynamics on Meradesh App. Available on Appstore and Play Store.
Reach your constituents, gain insights into their motivations, and build campaigns based on data-driven strategies with the Meradesh Platform.
Data Source – Meradesh.org