Location
Bathinda Lok Sabha constituency is one of the 13 Lok Sabha constituencies in the Indian state of Punjab. It comprises 9 assembly constituencies and 3 districts.
Category
Designated as a Scheduled Caste Constituency.
Voter Turnout
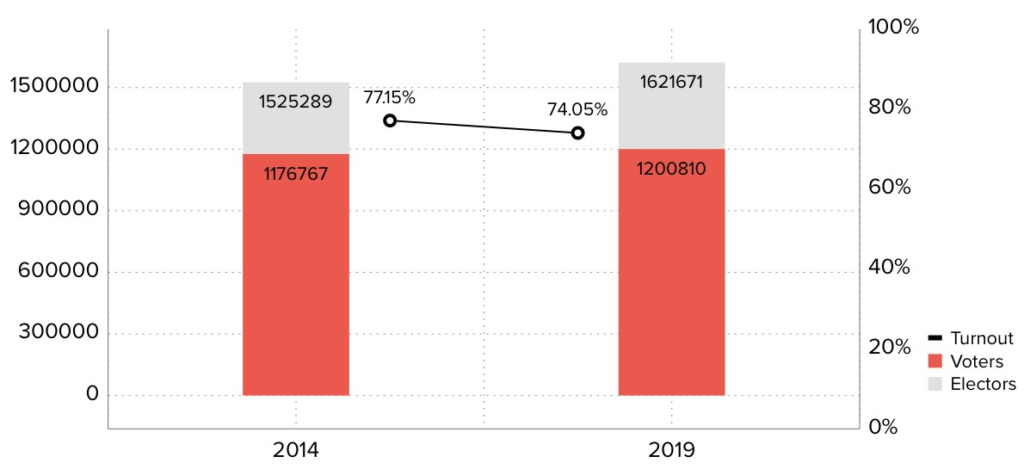
Bathinda Electoral Turnout Rates
During the 2014 elections, the total number of electors was 15,25,289 and the turnout stood at 77.15%, in real numbers- 11,76,767 voters. 2019 witnessed a turnout decrease; out of the 16,21,671 electors, 74.05% of voters exercised their constitutional rights. In real numbers- 12,00,810 voters.
Representation and Results
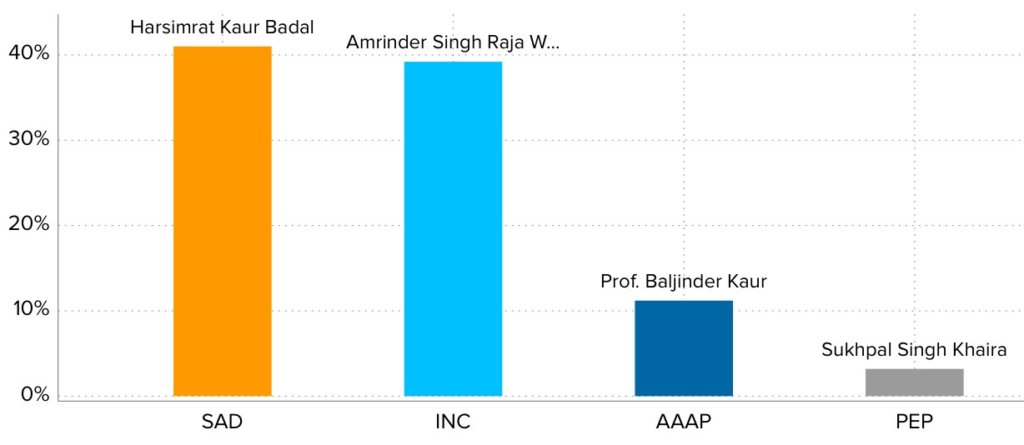
Party Wise Vote Share
2019’s parliamentary election winner, SAD’s Harsimrat Kaur Badal gained a vote share of 41.00% and defeated INC’s Amrinder Singh Raja whose vote share stood at 39.20%. The other prominent candidates in the fray were AAAP’s Prof. Baljinder Kaur with 11.20% of vote share and PEP’s Sukhpal Singh Khaira with 3.20%.
Voting History –2014 & 2019

Party Wise Shift in Votes
In 2014, SAD won the constituency and earned 5,14,727 votes followed by 4,92,824 votes in the 2019 election victory. On the other hand, INC garnered 4,95,332 votes in 2014 and 4,71,052 votes in the 2019 elections. AAAP received 87,901 votes in 2014 which substantially decreased to 1,34,398 votes in the 2019 elections.
Parties at helm through the years
In the year 1952 and 1957, the Indian National Congress (INC) emerged victorious. The 1962 elections marked a win for the Shiromani Akali Dal (SAD) and the trend continued with the SAD securing another victory in 1967. The year 1971 saw a change, as the Communist Party of India (CPI) came into power before SAD reclaimed power with a victory in 1977. The Indian National Congress (INC) regained its position in 1980. SAD came victorious in the 1984 elections and continued its claim to power with another win in 1989. The Indian National Congress (INC) made a comeback in 1991.

Timeline of Winning Parties
1996 witnessed another triumph for the Shiromani Akali Dal (SAD) and the trend continued in 1998, with the SAD securing victory. In 1999, the Communist Party of India (CPI) managed to secure a win. 2004 marked a return to victory for the Shiromani Akali Dal (SAD) and maintained its presence in the constituency with consecutive victories in 2009,2014 and 2019 elections.
Party-wise success rate
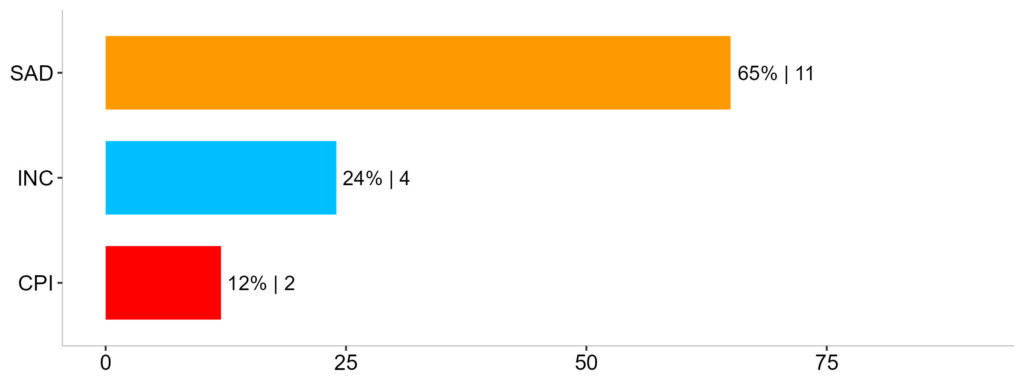
Success Rate
In terms of the success rate in securing the Bathinda Lok Sabha seat, INC had exhibited the highest rate of success in the elections held since 2009, standing at 65% followed by BJP at 24% and CPI at 12%.
Gender Wise Distribution of Contestants
During the 2009 elections, there were 22 contestants, among which 20 were males and 2 females, in percentage- 91% and 9% respectively. The next elections in 2014 saw an increase in contestant participation to 29 whereby 27 were males and 2 females, in percentage- 93% and 7% respectively.
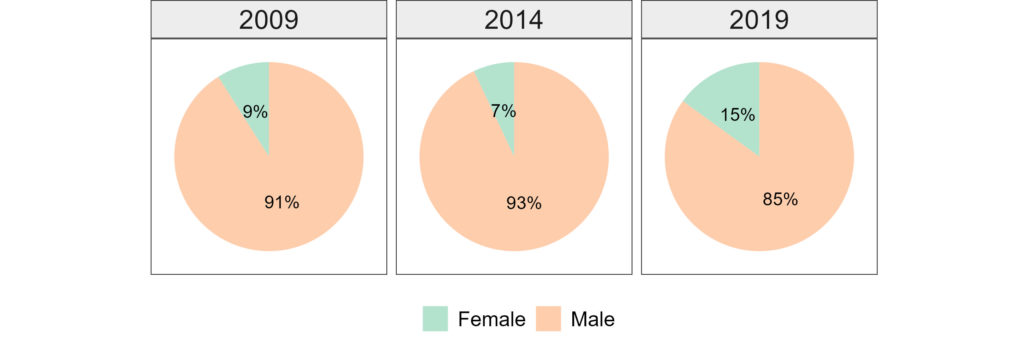
Gender Wise Distribution of Candidates
In 2019, the total number of contestants saw a slight decrease, with 27 individuals participating. Among them, 23 were male candidates, constituting 85% of the total, while 4 were female candidates, making up the remaining 15%.
Gender wise voter turnout
In 2009, out of a total of 13,32,496 electors, 10,49,313 voters cast their ballots. Of the 7,00,661 male electors, 5,58,337 participated in the election, constituting a turnout rate of 80%. There were 6,31,835 female electors and of that, 4,90,976 chose to vote with a turnout rate of 78%.
In 2014, there are 15,25,289 people who are eligible to vote and 11,76,767 of them chose to exercise their right to vote. Out of these, 8,13,119 were male electors and 7,12,170 were female electors. 77% of male electors (6,27,099) and 77% of female electors (5,49,668) cast their ballots.
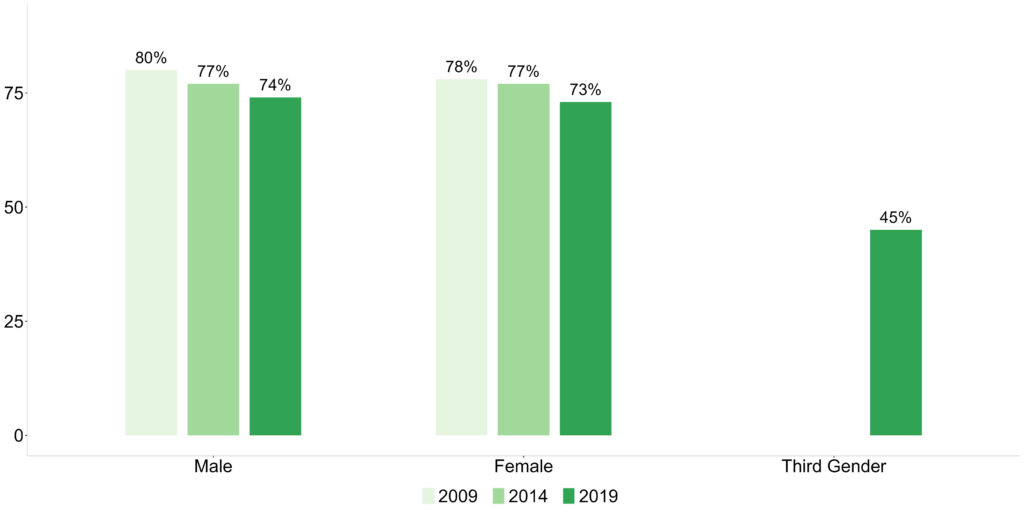
Gender Wise Voter Turnout
The total count of electors in 2019 was 16,21,671 out of which 11,95,810 chose to cast their ballot in the parliamentary elections. Out of 8,61,387 male electors, only 74% voted which is 6,39,646 male voters in real numbers. On the other hand, the voter turnout for females stood at 73% which translates to 5,56,155 voters out of a total of 7,60,264 female electors in real number.
In 2017, transgender people were included as a separate category of the third gender in electoral rolls. There were 20 electors belonging to the third gender category in the parliamentary constituency during the 2019 elections. And 9 of them exercised their newly granted constitutional right to vote and thus their turnout stood at 45%.
Gender-Wise Literacy Rate
We are taking a peek at the gender-wise literacy rate of the Muktsar, Mansa and Bathinda districts which are part of the Bathinda parliamentary constituency as literacy is considered an essential indicator of the socioeconomic development of the region.
Bathinda District
The 2011 census of India has pegged the overall literacy rate of the Bathinda district at 61%. Gender-wise, the male literacy rate in the district is 66% whereas, for females, the literacy rate stands at 55%.
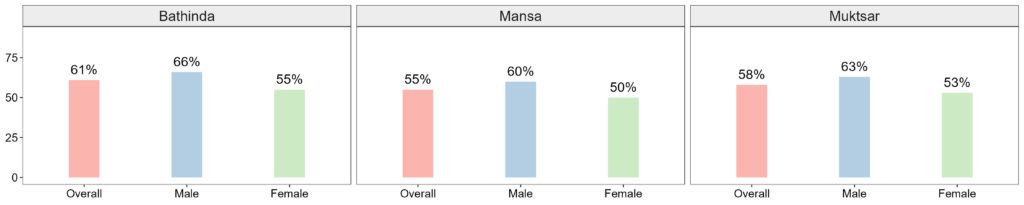
Gender Wise Literacy Rate
Mansa District
The overall literacy rate of the district is 50%. However, when it comes to gender, the literacy rate for males in the district stands at 60% while the female literacy rate is 50%.
Muktsar District
The district boasts an overall literacy rate of 58% with healthy representation by both males and females at 63% and 53% respectively.
Stay updated on the electoral statistics for parliamentary constituencies and the changing dynamics on Meradesh App. Available on Appstore and Play Store.
Reach your constituents, gain insights into their motivations, and build campaigns based on data-driven strategies with the Meradesh Platform.
Data Source – Meradesh.org