Location
Ludhiana Lok Sabha constituency is one of the 13 Lok Sabha constituencies in the Indian state of Punjab. It comprises 9 assembly constituencies and a district.
Category
Designated as a General Constituency.
Voter Turnout
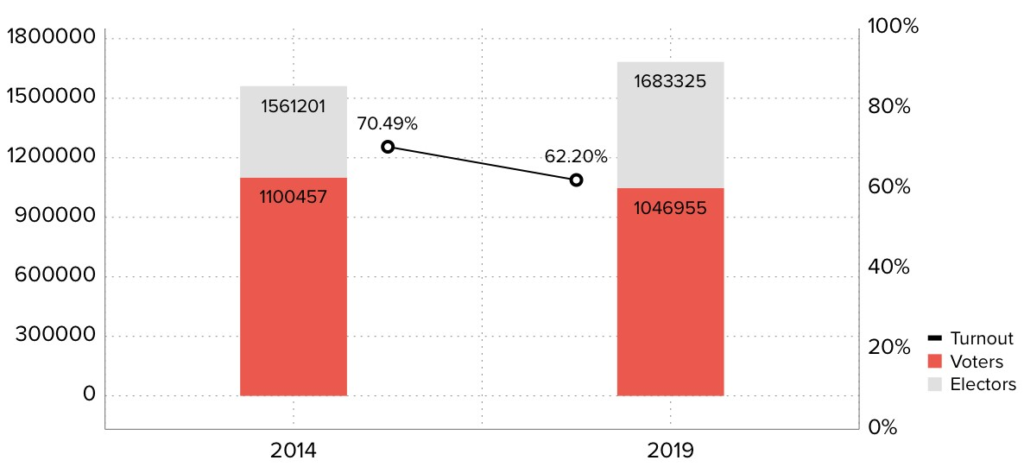
Ludhiana Electoral Turnout Rates
During the 2014 elections, the total number of electors was 15,61,201 and the turnout stood at 70.49%, in real numbers- 11,00,457 voters. 2019 witnessed a turnout decrease; out of the 16,83,325 electors, 62.20% of voters exercised their constitutional rights. In real numbers- 10,46,955 voters.
Representation and Results
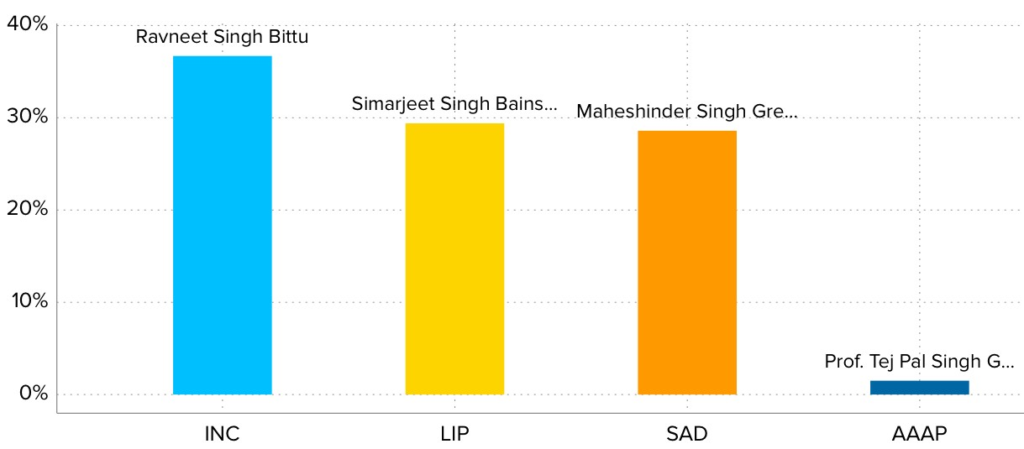
Party Wise Vote Share
2019’s parliamentary election winner, INC’s Ranveet Singh Bittu gained a vote share of 36.70% and defeated LIP’s Simarjeet Singh Bains whose vote share stood at 29.40%. The other prominent candidates in the fray were SAD’s Maheshinder Singh with 28.60% of vote share and AAAP’s Professor Tej Pal Singh Gill with 1.50%.
Voting History –2014 & 2019
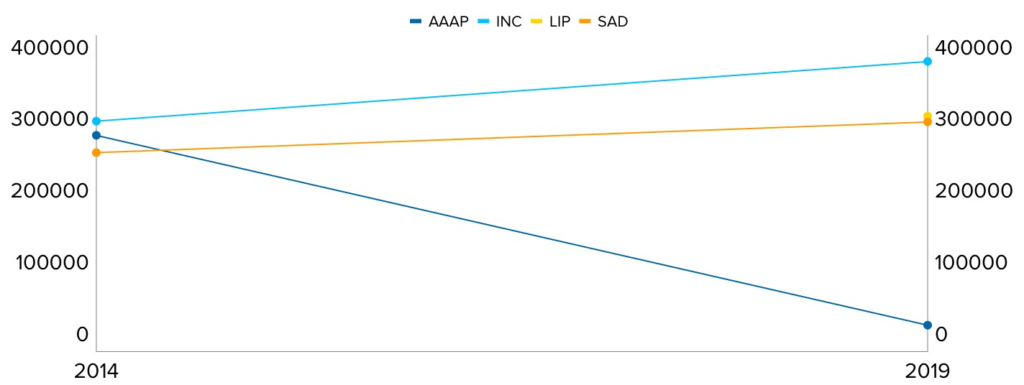
Party Wise Shift in Votes
In 2014, INC won the constituency and earned 3,00,459 votes followed by 3,83,795 votes in the 2019 election victory. On the other hand, SAD garnered 2,56,590 votes in 2014 and 2,99,435 votes in the 2019 elections. AAAP got 2,80,750 votes in 2014 and 15,945 votes in 2019.
Parties at helm through the years
The Ludhiana constituency has been represented by a number of different parties over the years.
In 1952, the Indian National Congress (INC) emerged as the winning party. The INC continued to secure victories in 1957 and 1967, with a by-election in 1957 strengthening their position further. In 1962, the Socialist Party (SWP) had a successful year. In 1971, the INC once again secured victory. The year 1977 witnessed the rise of the Shiromani Akali Dal (SAD) as the winning party. In 1980 and 1992, the INC regained its position.

Timeline of Winning Parties
The SAD won in 1984, 1989, 1996, and 1998, showing significant support during those years. In 1999, the INC secured a win. In 2004 the SAD emerged victorious before losing the seat to the INC in 2009. The INC further consolidated its position in the constituency with back-to-back wins in elections held in 2014 and 2019.
Party-wise success rate
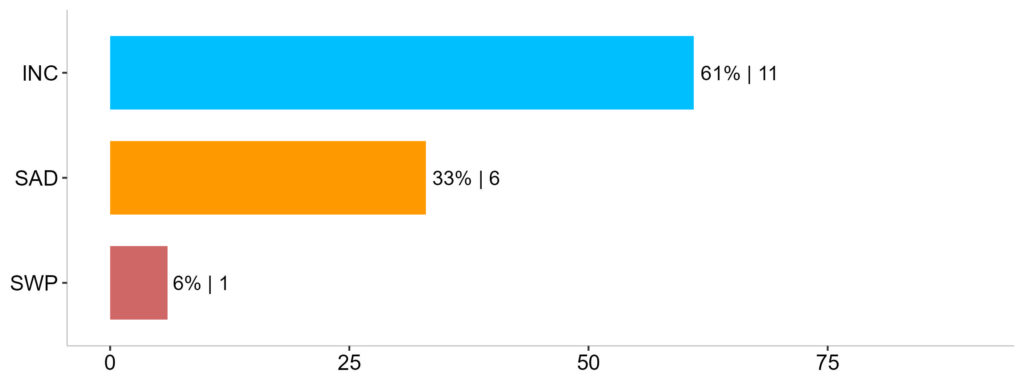
Success Rate
In terms of the success rate in securing the Ludhiana Lok Sabha seat, INC had exhibited the highest rate of success over the years, standing at 66% followed by SAD with 33%.
Gender Wise Distribution of Contestants

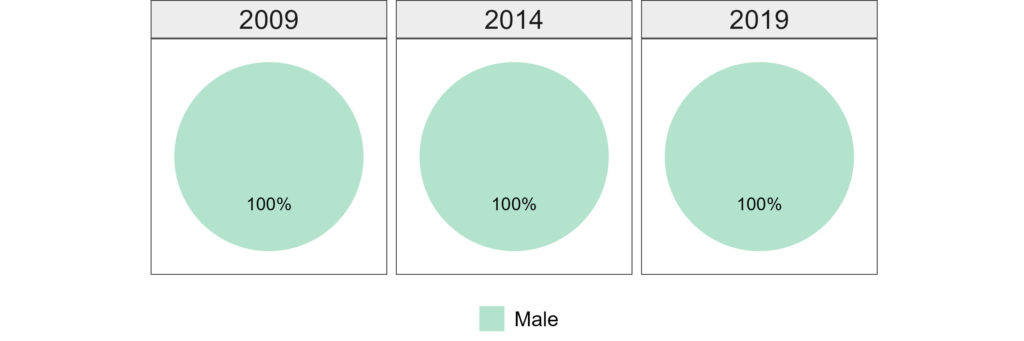
Gender Wise Distribution of Candidates
During the 2009 elections, there were 30 contestants and all of them were male. In 2014 and 2019 the total number of contestants decreased to 22 each and like the prior election there was no female contestant in these elections.
Gender wise voter turnout
In 2009, out of a total of 13,07,873 electors, 8,46,834 voters cast their ballots. Of the 6,92,152 male electors, 4,59,278 participated in the election, constituting a turnout rate of 66%. There were 6,15,721 female electors and of that, 3,87,556 chose to vote with a turnout rate of 63%.
In 2014, there are 15,61,201 people who are eligible to vote and 11,00,457 of them chose to exercise their right to vote. Out of these, 8,35,632 were male electors and 7,25,569 were female electors. 72% of male electors (6,00,960) and 69% of female electors (4,99,497) cast their ballots.

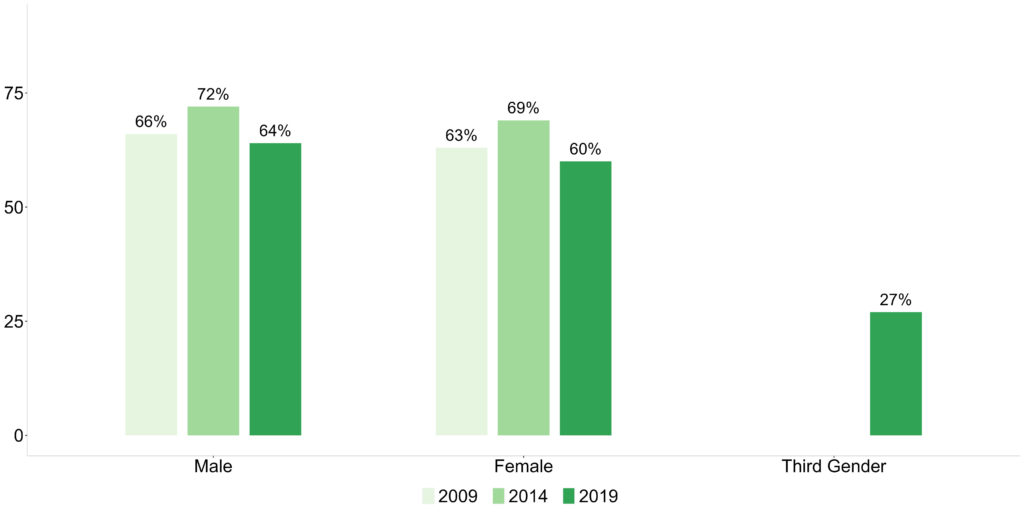
Gender Wise Voter Turnout
The total count of electors in 2019 was 16,83,325 out of which 10,44,888 chose to cast their ballot in the parliamentary elections. Out of 9,03,624 male electors, only 64% voted which is 5,76,920 male voters in real numbers. On the other hand, the voter turnout for females stood at 60% which translates to 4,67,949 voters out of a total of 7,79,630 female electors in real number.
In 2017, transgender people were included as a separate category of the third gender in electoral rolls. There were 71 electors belonging to the third gender category in the parliamentary constituency during the 2019 elections. And 19 of them exercised the newly granted constitutional right to vote and thus their turnout stood at 27%.
Gender-Wise Literacy Rate
We are taking a peek at the gender-wise literacy rate of the Ludhiana district which is part of the Ludhiana parliamentary constituency as literacy is considered an essential indicator of the socioeconomic development of the region.
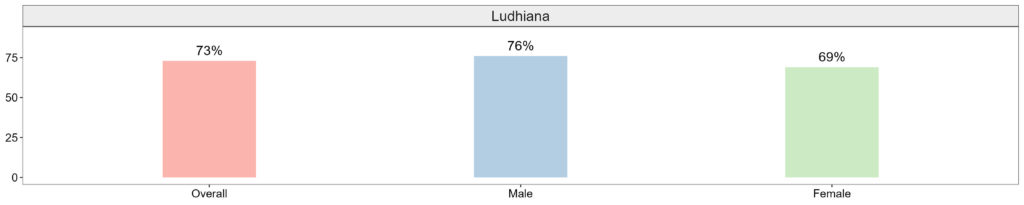
Gender Wise Literacy Rate
Ludhiana District

The 2011 census of India has pegged the overall literacy rate of the district at 73%. Gender-wise, the male literacy rate in the district is 76% whereas, for females, the literacy rate stands at 69%.
Stay updated on the electoral statistics for parliamentary constituencies and the changing dynamics on Meradesh App. Available on Appstore and Play Store.
Reach your constituents, gain insights into their motivations, and build campaigns based on data-driven strategies with the Meradesh Platform.
Data Source – Meradesh.org