Location
Anandpur Sahib Lok Sabha constituency is one of the 13 Lok Sabha constituencies in the Indian state of Punjab. It comprises 9 assembly constituencies and 4 districts.
Category
Designated as a General Constituency.
Voter Turnout
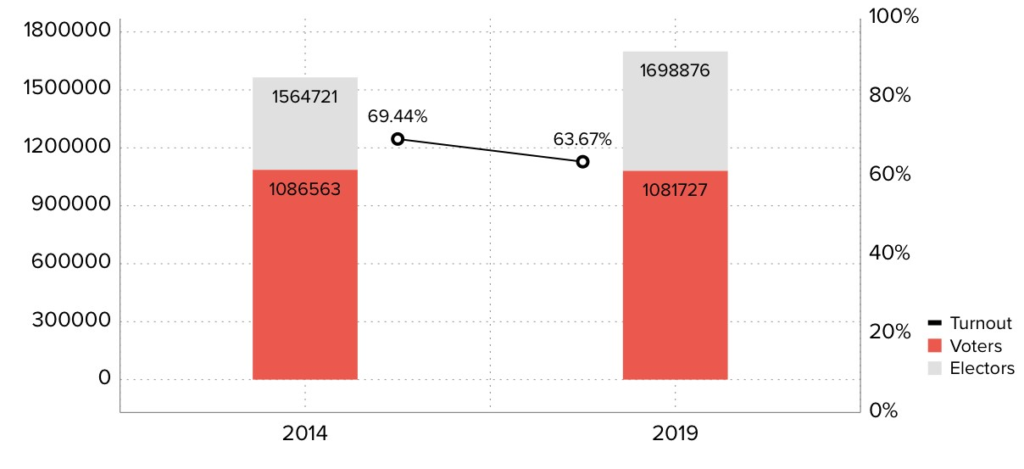
Anandpur Sahib Electoral Turnout Rates
During the 2014 elections, the total number of electors was 15,64,721 and the turnout stood at 69.44%, in real numbers- 10,86,563 voters. 2019 witnessed a turnout decrease; out of the 16,98,876 electors, 63.67% of voters exercised their constitutional rights. In real numbers- 10,81,727 voters.
Representation and Results
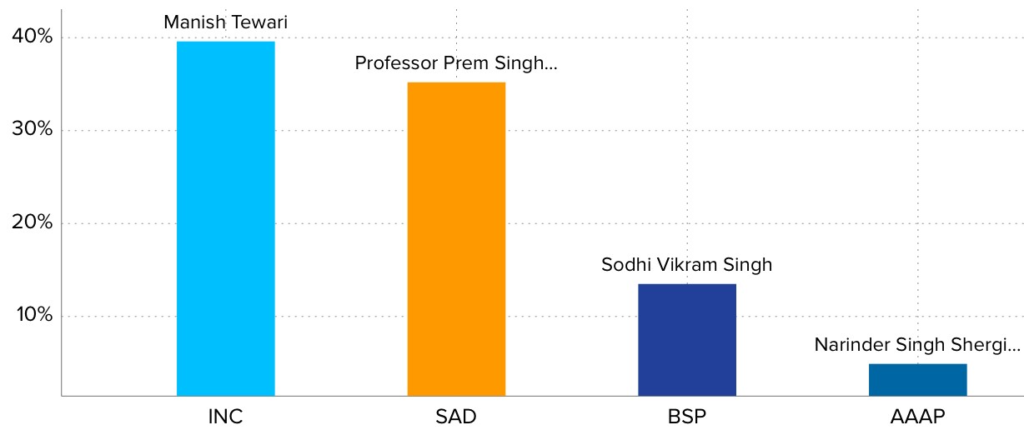
Party Wise Vote Share
2019’s parliamentary election winner, INC’s Manish Tewari gained a vote share of 39.60% and defeated BJP’s Professor Prem Singh whose vote share stood at 35.20%. The other prominent candidates in the fray were BSP’s Sodhi Vikram Singh with 13.50% of vote share and AAAP’s Narinder Singh Shergil with 4.90%.
Voting History –2014 & 2019
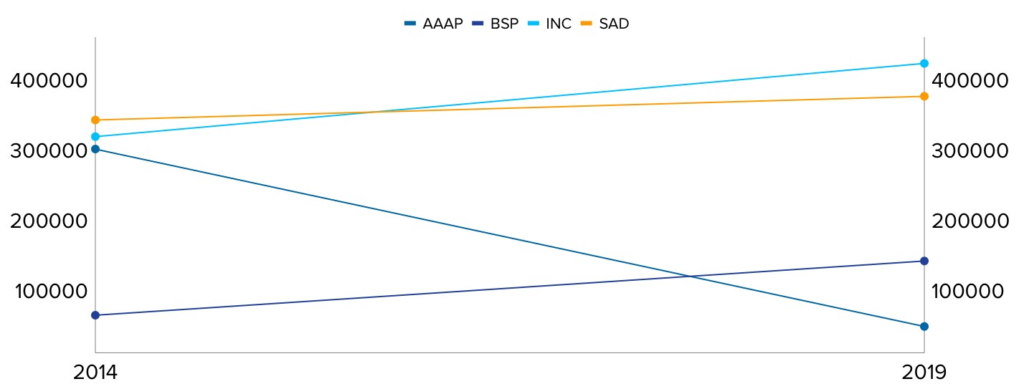
Party Wise Shift in Votes
In 2014, BJP won the constituency and earned 3,47,394 votes followed by 3,81,161 votes in the 2019 election victory. On the other hand, INC garnered 3,23,697 votes in 2014 and 4,28,045 votes in the 2019 elections. BSP received 3,06,008 votes in 2014 which substantially decreased to 53,052 votes in the 2019 elections.
Parties at helm through the years
This constituency came into existence as a part of the implementation of the delimitation of parliamentary and assembly constituencies in 2008. It has been represented by different parties over the years.

Timeline of Winning Parties
In 2009, the Indian National Congress (INC) emerged victorious, securing power. In the 2014 elections, the Shiromani Akali Dal (SAD) gained success and formed the government. However, in 2019, the INC made a comeback, reclaiming power once again.
Party-wise success rate
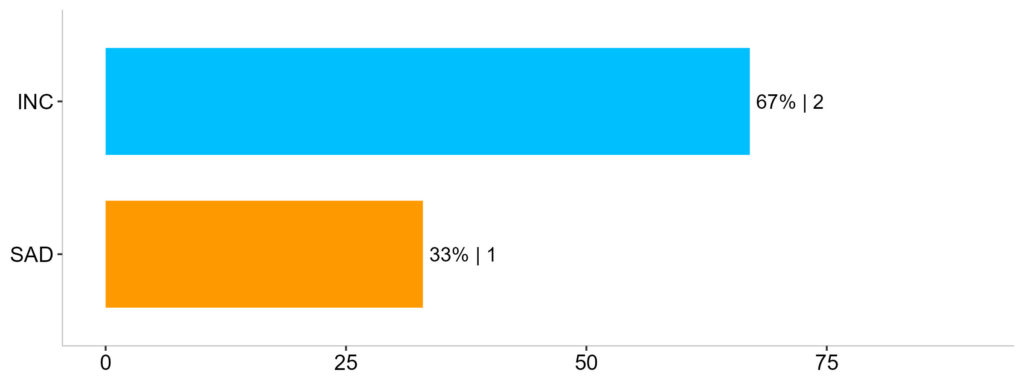
Success Rate
In terms of the success rate in securing the Anandpur Sahib Lok Sabha seat, INC had exhibited the highest rate of success in the elections held since 2009, standing at 67% followed by SAD at 33%.
Gender Wise Distribution of Contestants
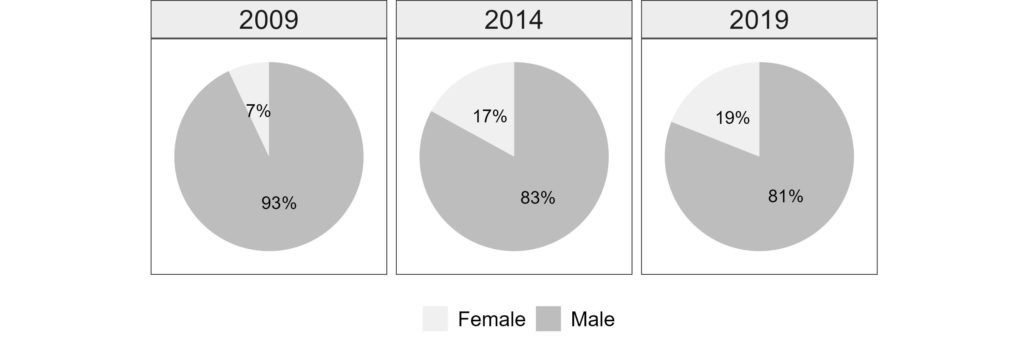
Gender Wise Distribution of Candidates
During the 2009 elections, there were 14 contestants and among them, 13 were males while 1 was female, in percentage- 93% and 7% respectively. In 2014, the total number of contestants increased to 18 out of which 15 were male and 3 were female, in percentage- 83% and 17%.
In 2019, on the other hand, the total number of contestants further increased to 26 whereby 21 were males and 5 females, in percentage that is 81% and 19% respectively.
Gender wise voter turnout
In 2009, out of a total of 13,32,519 electors, 9,05,088 voters cast their ballots. Of the 6,89,814 male electors, 4,59,253 participated in the election, constituting a turnout rate of 67%. There were 6,42,705 female electors and of that, 4,45,835 chose to vote with a turnout rate of 69%.
In 2014, there are 15,64,721 people who are eligible to vote and 10,86,563 of them chose to exercise their right to vote. Out of these, 8,17,186 were male electors and 7,47,535 were female electors. 68% of male electors (5,54,256) and 71% of female electors (5,32,307) cast their ballots.
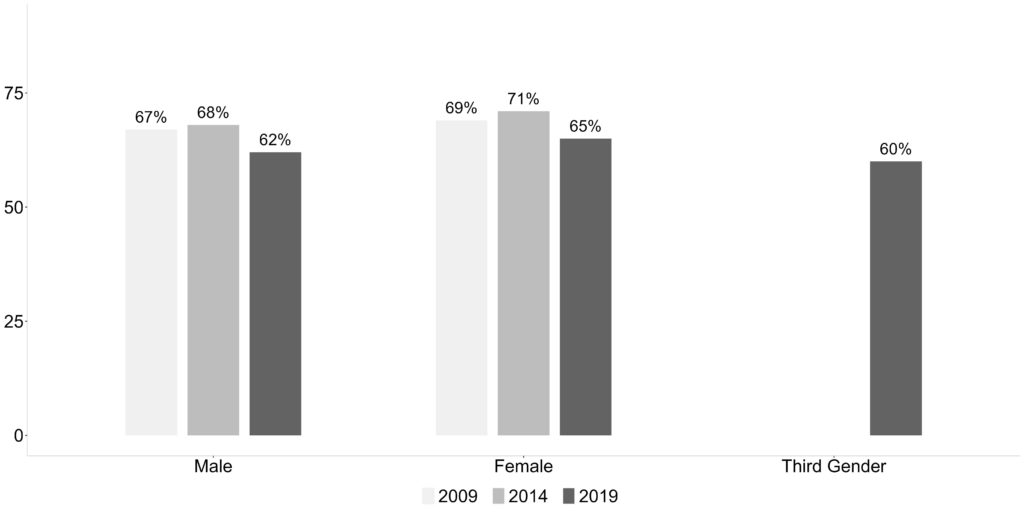
Gender Wise Voter Turnout
The total count of electors in 2019 was 16,98,876 out of which 10,77,521 chose to cast their ballot in the parliamentary elections. Out of 8,89,506 male electors, only 62% voted which is 5,53,140 male voters in real numbers. On the other hand, the voter turnout for females stood at 65% which translates to 5,24,356 voters out of a total of 8,09,328 female electors in real number.
In 2017, transgender people were included as a separate category of the third gender in electoral rolls. There were 42 electors belonging to the third gender category in the parliamentary constituency during the 2019 elections. And 25 of them exercised their newly granted constitutional right to vote and thus their turnout stood at 60%.
Gender-Wise Literacy Rate
We are taking a peek at the gender-wise literacy rate of the Hoshiarpur, Nawanshahr, Mohali and Rupnagar districts which are part of the Anandpur Sahib parliamentary constituency as literacy is considered an essential indicator of the socioeconomic development of the region.
Hoshiarpur District
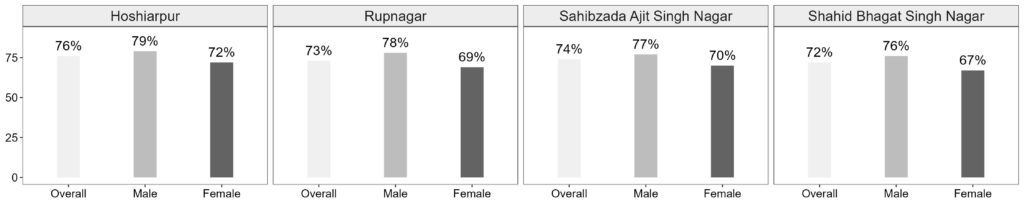
The 2011 census of India has pegged the overall literacy rate of the Anandpur Sahib district at 76%. Gender-wise, the male literacy rate in the district is 79% whereas, for females, the literacy rate stands at 72%.
Shahid Bhagat Singh Nagar District
The overall literacy rate of the district is 72%. However, when it comes to gender, the literacy rate for males in the district stands at 76% while the female literacy rate is 67%.
Gender Wise Literacy Rate
Rupnagar District
The Ghaziabad district’s overall literacy rate is 73%. In terms of gender, the literacy rate for male stands at 78% whereas it is 69% for females.
Sahibzada Ajit Singh Nagar District
The district boasts an overall literacy rate of 74% with healthy representation by both males and females at 77% and 70% respectively.
Stay updated on the electoral statistics for parliamentary constituencies and the changing dynamics on Meradesh App. Available on Appstore and Play Store.
Reach your constituents, gain insights into their motivations, and build campaigns based on data-driven strategies with the Meradesh Platform.
Data Source – Meradesh.org